Feedforward networks and gradient descent
This lecture builds a two-layer network of perceptrons that solves XOR. It then trains a sigmoid neuron with gradient descent. After this page you can compute a gradient-descent weight update by hand. You can also pick the loss that fits the task.
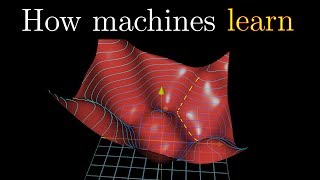 How neural networks learn
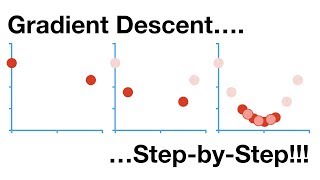 Gradient Descent Step-by-Step
 Cross Entropy
 SGD Clearly Explained
The king's wine puzzleSearch on YouTube
A king receives 1000 gift bottles of wine. Exactly one bottle is poisoned. Anyone who drinks it dies exactly 8 hours later. The feast starts in 9 hours, so only one round of testing is possible. The king has 10 prisoners for the tests. The task is to find the poisoned bottle with these 10 testers.
Each prisoner gives one yes-or-no answer: dead or alive. Ten answers form a 10-bit code. The Bottle labels are the code words.
Ten binary answers give patterns. That covers all 1000 bottles. Number the bottles from 0 to 999 in binary. Each bottle label has 10 bits. Prisoner sips from every bottle whose bit equals 1. After 8 hours the death pattern spells the poisoned bottle in binary.
Worked example. Bottle 637 is poisoned. Find which prisoners die.
Step 1. Write 637 in binary.
Step 2. Read the deaths. Prisoners 0, 2, 3, 4, 5, 6 and 9 die. Prisoners 1, 7 and 8 live. The pattern is 1001111101, which equals .
One yes-or-no unit carries one bit of information. A perceptron network works the same way. It combines many small yes-or-no units into one decision.
Networks of perceptronsSearch on YouTube
A single perceptron cannot separate the XOR points. No single straight line does the job. A network of perceptrons can. It dedicates one hidden unit to each input pattern. Then the output unit fires for the wanted patterns.
Layers of the networkSearch on YouTube
The network has 3 layers. The input layer holds and . The hidden layer holds 4 perceptrons with outputs . The output layer holds one neuron with output . The input-to-hidden connections are the layer 1 weights. The hidden-to-output connections are the layer 2 weights.
One hidden unit per input patternSearch on YouTube
Each hidden perceptron fires for exactly one input pattern. No two units fire for the same input. Use bipolar inputs . The unit for pattern takes weights . It fires when the weighted sum exceeds 1. A matching pattern gives . A one-bit mismatch gives . A full mismatch gives . Only the match passes the threshold.
is the pattern of unit . At most one hidden unit fires at a time.
| Unit | Pattern | Weights | Fires for |
|---|---|---|---|
XOR output weightsSearch on YouTube
The output neuron fires when exceeds . The slides call the threshold. It equals the negative bias. XOR is true for patterns 2 and 3 only. So set the layer 2 weights to with . The output is an OR of and .
are the layer 2 weights. is the threshold of the output neuron.
Worked example. Trace XOR with weights and .
Step 1. Hidden units. Each input fires exactly one hidden unit.
| Sum | ||||||
|---|---|---|---|---|---|---|
| 1 | 0 | 0 | 0 | 0 | 0 | |
| 0 | 1 | 0 | 0 | 1 | 1 | |
| 0 | 0 | 1 | 0 | 1 | 1 | |
| 0 | 0 | 0 | 1 | 0 | 0 |
Step 2. Compare with 0.5. Sums of 1 exceed 0.5, so . Sums of 0 do not, so . The output column equals XOR.
For binary inputs there are patterns. Use hidden units (one per pattern) plus 1 output unit. The slides print "2n", but the example proves the exponent: 2 inputs need 4 units.
The slides note a smaller alternative construction for XOR. It uses fewer hidden units. The idea above is the general one: it works for any Boolean function.
Learnable parametersSearch on YouTube
A fixed network solves logic by hand design. Learning finds the weights from data. Train one sigmoid neuron on two points: and . Find and with and . The learnable parameters are the weight and the bias .
The neuron output uses the sigmoid activation function:
is the weight and is the bias. The output lies between 0 and 1.
Fit quality uses the mean squared error loss:
is the predicted value. is the label. This loss is per-sample error averaged over samples.
Start with random values and .
Worked example. Compute the loss at , .
Step 1. First point . .
Step 2. Second point . .
Step 3. Mean.
Now update and by hand. Try larger and smaller . The loss falls. Repeat until the loss reaches 0. An exact fit exists here: and pass the sigmoid through both points. Check: , so . And , so .
Error surfaceSearch on YouTube
Plot the loss over the plane. This problem has two parameters and two points. The surface is a valley. The loss is lowest where is large and is small. The blue region of the slide marks this valley floor. Manual search walks downhill by trial and error. Gradient descent walks downhill with a rule.
Gradient descentSearch on YouTube
Brute-force search of the error surface is slow. Gradient descent is the better way. Collect the parameters in one vector . Find the change that reduces the loss. Take only a small step . Here is the learning rate, a small scalar between 0 and 1. The small step keeps convergence stable.
Update ruleSearch on YouTube
The gradient points in the direction of steepest ascent. To minimise the loss, move the opposite way. The required change is .
is the parameter vector. is the learning rate. is the gradient of the loss.
Why the negative gradient worksSearch on YouTube
A first-order Taylor expansion predicts the loss after a small step. It uses the gradient and the step.
is the dot product of the gradient with the step. It measures the rate of change of the loss in direction .
The dot product sign decides the outcome. Positive means the loss rises in direction . Negative means the loss falls. Zero means no change in that direction. With the change equals . A squared norm is never negative. So the new loss is never larger than the current loss.
Gradient in one and two dimensionsSearch on YouTube
The gradient is the multi-dimensional slope. It tells two things: which direction raises the function fastest, and how steep that rise is.
For one variable the gradient is a scalar. For two variables it is a vector of partial derivatives.
Loss surface is non-convexSearch on YouTube
The loss surface of a neural network is non-convex. It holds many local minima. It can also hold saddle points and flat regions. Gradient descent settles into one local minimum. The starting point decides which one.
Do not expect the global minimum. Gradient descent only guarantees a local minimum. Different random starts can end at different minima.
Gradient update for the sigmoid neuronSearch on YouTube
Apply the chain rule to the sigmoid neuron with mean squared error loss. The loss varies with , varies with , and varies with and . The sigmoid derivative is . For one point :
and are the gradient components. The update is and . The constant factor 2 from the square folds into . For points, average over points.
Each point votes one tweak. The mean of the votes is the net update.
Worked example. One gradient step from , with . Reuse and from the loss example.
Step 1. Point 1 factors. .
Step 2. Point 2 factors. .
Step 3. Average and update with .
The weight rises and the bias falls. This matches the slide direction: increase , decrease . The new loss is about 0.071, below 0.073.
Read the sign before you update. A positive gradient component means decrease that parameter. A negative component means increase it. The size shows the impact of that parameter.
Loss functionsSearch on YouTube
The loss depends on the problem type. Regression predicts real values. Classification predicts probabilities. Each task needs its own loss and output activation function.
Mean squared errorSearch on YouTube
Use squared error with a linear output for real-valued labels. The formula is the above: mean of . The worked loss example gives for the two sigmoid points.
Binary cross entropySearch on YouTube
Use binary cross entropy for two-class problems. The label is 0 or 1. The prediction is the probability of class 1.
is the label. is the predicted probability of class 1. Confident wrong answers get large loss.
Cross entropySearch on YouTube
Use cross entropy for multi-class problems with a softmax output. The label is a one-hot vector over classes. The prediction is a probability distribution over the classes.
is 1 for the true class and 0 elsewhere. is the predicted probability of class . Only the true class term survives the sum.
Worked example. Binary case: label , prediction .
Same prediction, label .
The same 0.7 hurts far more when it backs the wrong class.
Worked example. Three classes, true class 3, predicted .
Confident and wrong: true class 1, predicted .
Which loss with which outputSearch on YouTube
| Task | Output activation function | Loss |
|---|---|---|
| Regression (real values) | Linear | Mean squared error |
| Classification (probabilities) | Softmax | Cross entropy (binary form for 2 classes) |
Do not pair softmax with squared error. Softmax outputs a distribution, so score it with cross entropy. Do not feed raw scores into cross entropy either. Convert them to probabilities first.
Universal approximationSearch on YouTube
A multilayer perceptron with one hidden layer can approximate any continuous function to any desired precision. Give it enough hidden neurons. Then for every continuous there is a network whose output stays within any asked tolerance of .
One hidden layer suffices in theory. The catch is the width it may need.
The catch is the curse of dimensionality. Building a tower function in dimensions needs a number of neurons that grows like . The count explodes as grows.
is a constant per dimension. The exponential growth in is the curse of dimensionality.
Backpropagation ideaSearch on YouTube
Backpropagation serves every artificial neural network. It sends the output error back through the layers. Each layer then fixes its own weights and bias. Full derivation belongs to the training lecture. The idea here sets it up.
An image becomes a flat vector first. Flatten a image row by row into a 784-vector. Feed it through a suitable network. Compare the predicted probabilities with the desired probabilities. The slides score them with summed squared differences. Its mean is the empirical risk. Large risk means poor performance. Small changes to and lower it.
Training repeats three steps. It keeps cycling until the risk stops falling. This cycle is training, also called optimisation.
F-L-B: Feedforward, Loss, Backprop
Feedforward passes data forward · Loss scores the output · Backprop sends the error back and updates the weights.
Average the per-point tweaks into one net tweak. Update after each data point for plain gradient descent. Average over a minibatch of choice for stochastic gradient descent. The sign of each gradient component picks the direction. Its size picks the step impact.
Quick self-testSearch on YouTube
1. Ten prisoners test wine, one dies-or-lives round. How many bottles can they cover, and why?
bottles. Each prisoner adds one bit, so 10 answers encode 1024 patterns. That covers 1000 bottles with 24 patterns spare.
2. Input enters the XOR network. Which hidden unit fires, and what is y?
Only fires, since . The output sum is 1, which exceeds 0.5. So .
3. A Boolean function has 3 inputs. How many hidden units does the one-pattern-per-unit construction need?
hidden units plus 1 output unit. Each of the 8 input patterns gets its own unit.
4. Sigmoid neuron, , , points and . What is the mean squared error loss?
and . Squared errors are 0.1312 and 0.0151. Mean loss .
5. Run one gradient step from the state in question 4 with learning rate 1. What are the new w and b?
and . New . New . Weight rises, bias falls, loss drops to about 0.071.
6. Binary label with , then label with . Give both losses.
For : . For : . Same confidence, wrong side, much larger loss.
7. Differentiate the regression setup from the classification setup (output plus loss).
Regression uses a linear output with mean squared error loss. Classification uses a softmax output with cross entropy loss. Match the loss to the output type.
8. Why does gradient descent step in the negative gradient direction?
The Taylor step changes the loss by . With this equals . So the loss cannot rise.
9. The loss surface is non-convex. What does that imply for training, and what do gradient sign and size tell you?
Training can stop at different local minima or stall on saddle flats, based on the start. The sign tells whether to raise or lower the parameter. The size tells the impact of that parameter.
10. List the three training steps, and state the flattened size of a 28 by 28 image.
Feedforward, loss calculation, backpropagation, repeated until the risk stops falling. A image flattens row by row into a 784-vector.
- Ten binary testers cover bottles: label each bottle in binary and let tester sip where bit is 1.
- A 2-input XOR network uses 4 hidden perceptrons (one per pattern) plus 1 output unit; inputs need hidden units.
- Output fires when ; weights with give XOR.
- Sigmoid neuron: with ; learnable parameters are and .
- Mean squared error : the slide start gives .
- Gradient descent: ; Taylor gives change .
- Sigmoid gradient step: , , averaged over points; one step with gives , .
- Binary cross entropy ; multi-class .
- Linear output pairs with squared error (regression); softmax output pairs with cross entropy (classification).
- One hidden layer approximates any continuous ; width grows like (curse of dimensionality).
- Training cycles feedforward, loss, backprop; per-point updates are gradient descent and minibatch-averaged updates are stochastic gradient descent.